CASE Gartner
During my fantastic job-time in Kaspersky (it’s not a lab anymore), I was lucky to be a Product Designer in many teams and took part in plenty of products, including IIoT, IoT ERP, IoT PLM. On this page I will summarize my cases and achievement, so during a reading, you can empathy and mix it with your experience/worldview, all of this. It’s not a case, it’s the story. Let’s start.
Traditional business model + IT technology, these are only monetary losses, so mostly I thought how traditional business models of manufacturers need to be optimized by Kaspersky to achieve win-win success. All my design was put through this approach.
Shortly: KICS analyzes traffic for process anomalies and detects network attacks and unauthorized communications within the industrial network.

I know, you are about to scroll down mockups and thinks: heh, it’s just another table and another dashboard. But believe me, there are unbelievable amount of details. I will show you:
Research of Cyber Security of Industrial Control Systems and UX Testing 🔥
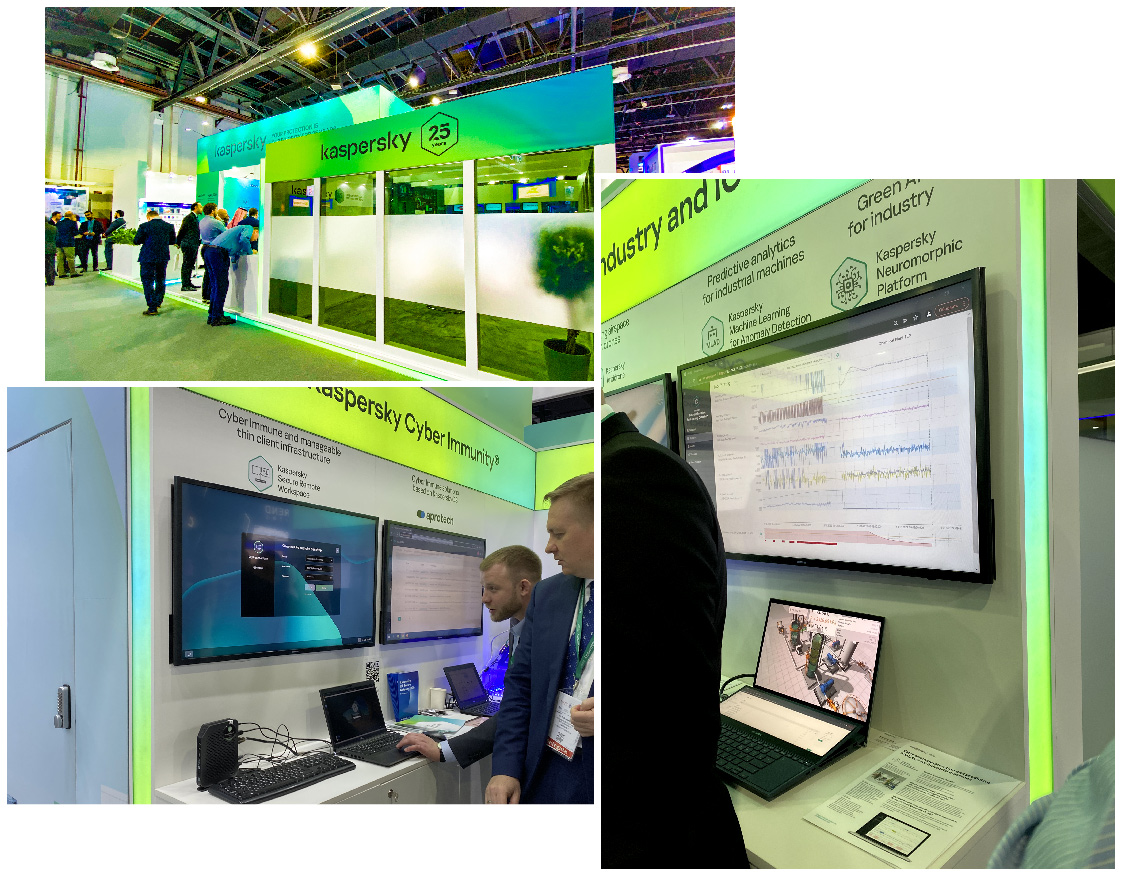
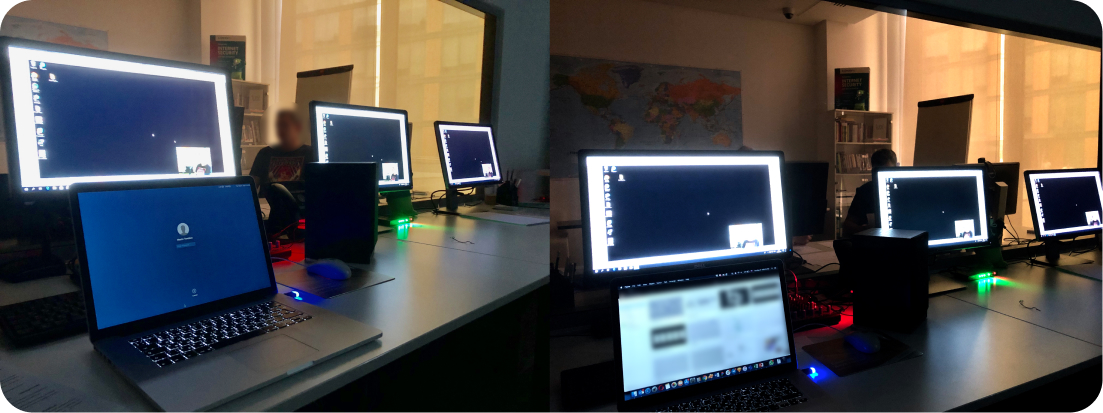
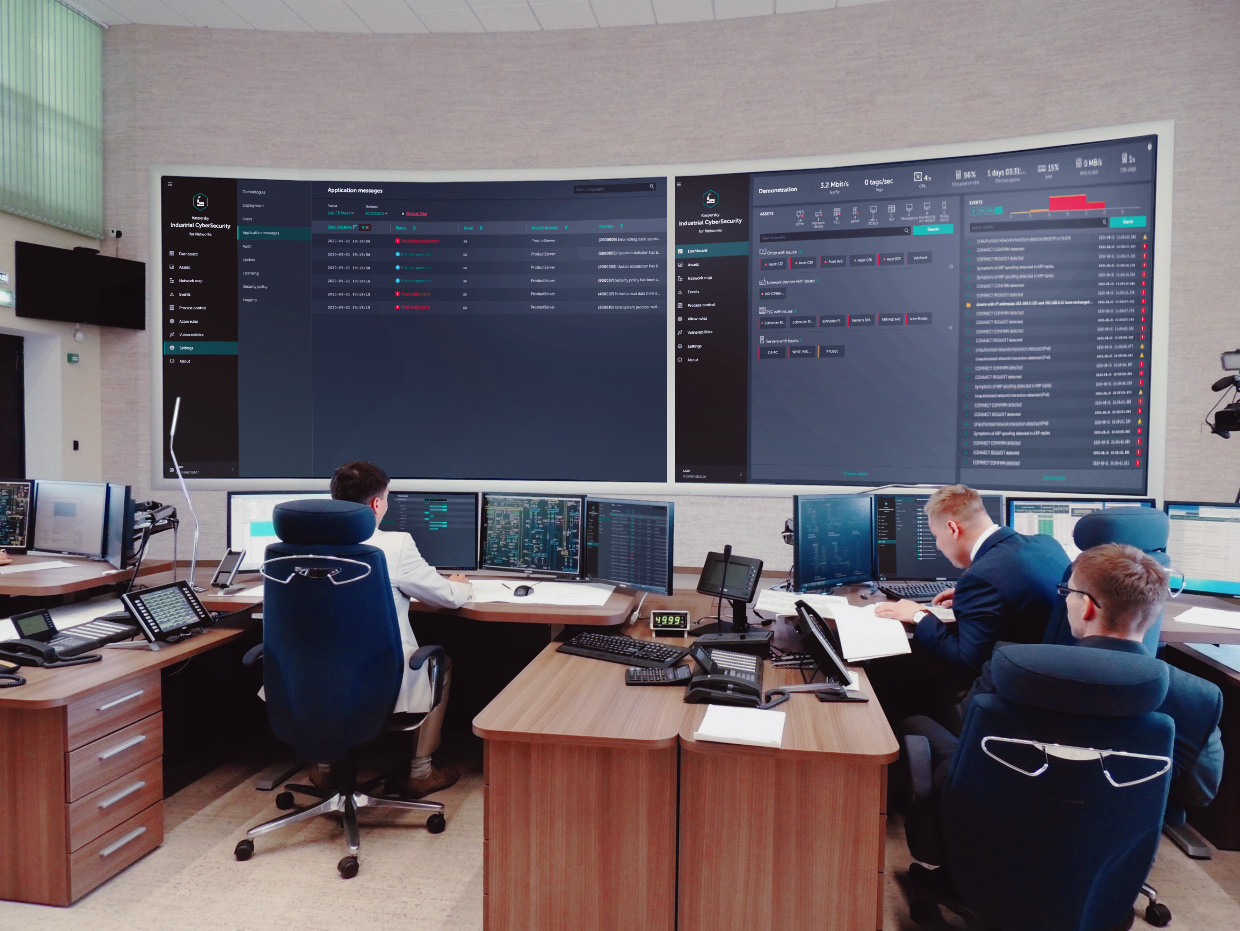
Mostly, IT companies have no expertise with real production on manufactures, so for starters, I went to the real factory. I wanted to get this experience, it’s so interesting to visit a real factories, and watch, how all business-processes works.
You know this is about a real sector of production. You can’t find here clear office, polite people, it’s mostly about an enormous room, dirty production hall, ambient concentrations of heavy metals in the air, deafening boom in the workings of the machines. Many fancy fashion designers just can’t keep performing in these conditions. They can’t even turn on their MacBook, because of a big electromagnetic field.
Ok, how we can do it? So, we started to research. First of all, we collected data: we took the simplest sensors for machines to show, it is on or off, working at idle or brings real benefits. Before, all manufacturers use the traditional method and visual observation: stopwatch and work day map (on the paper!).
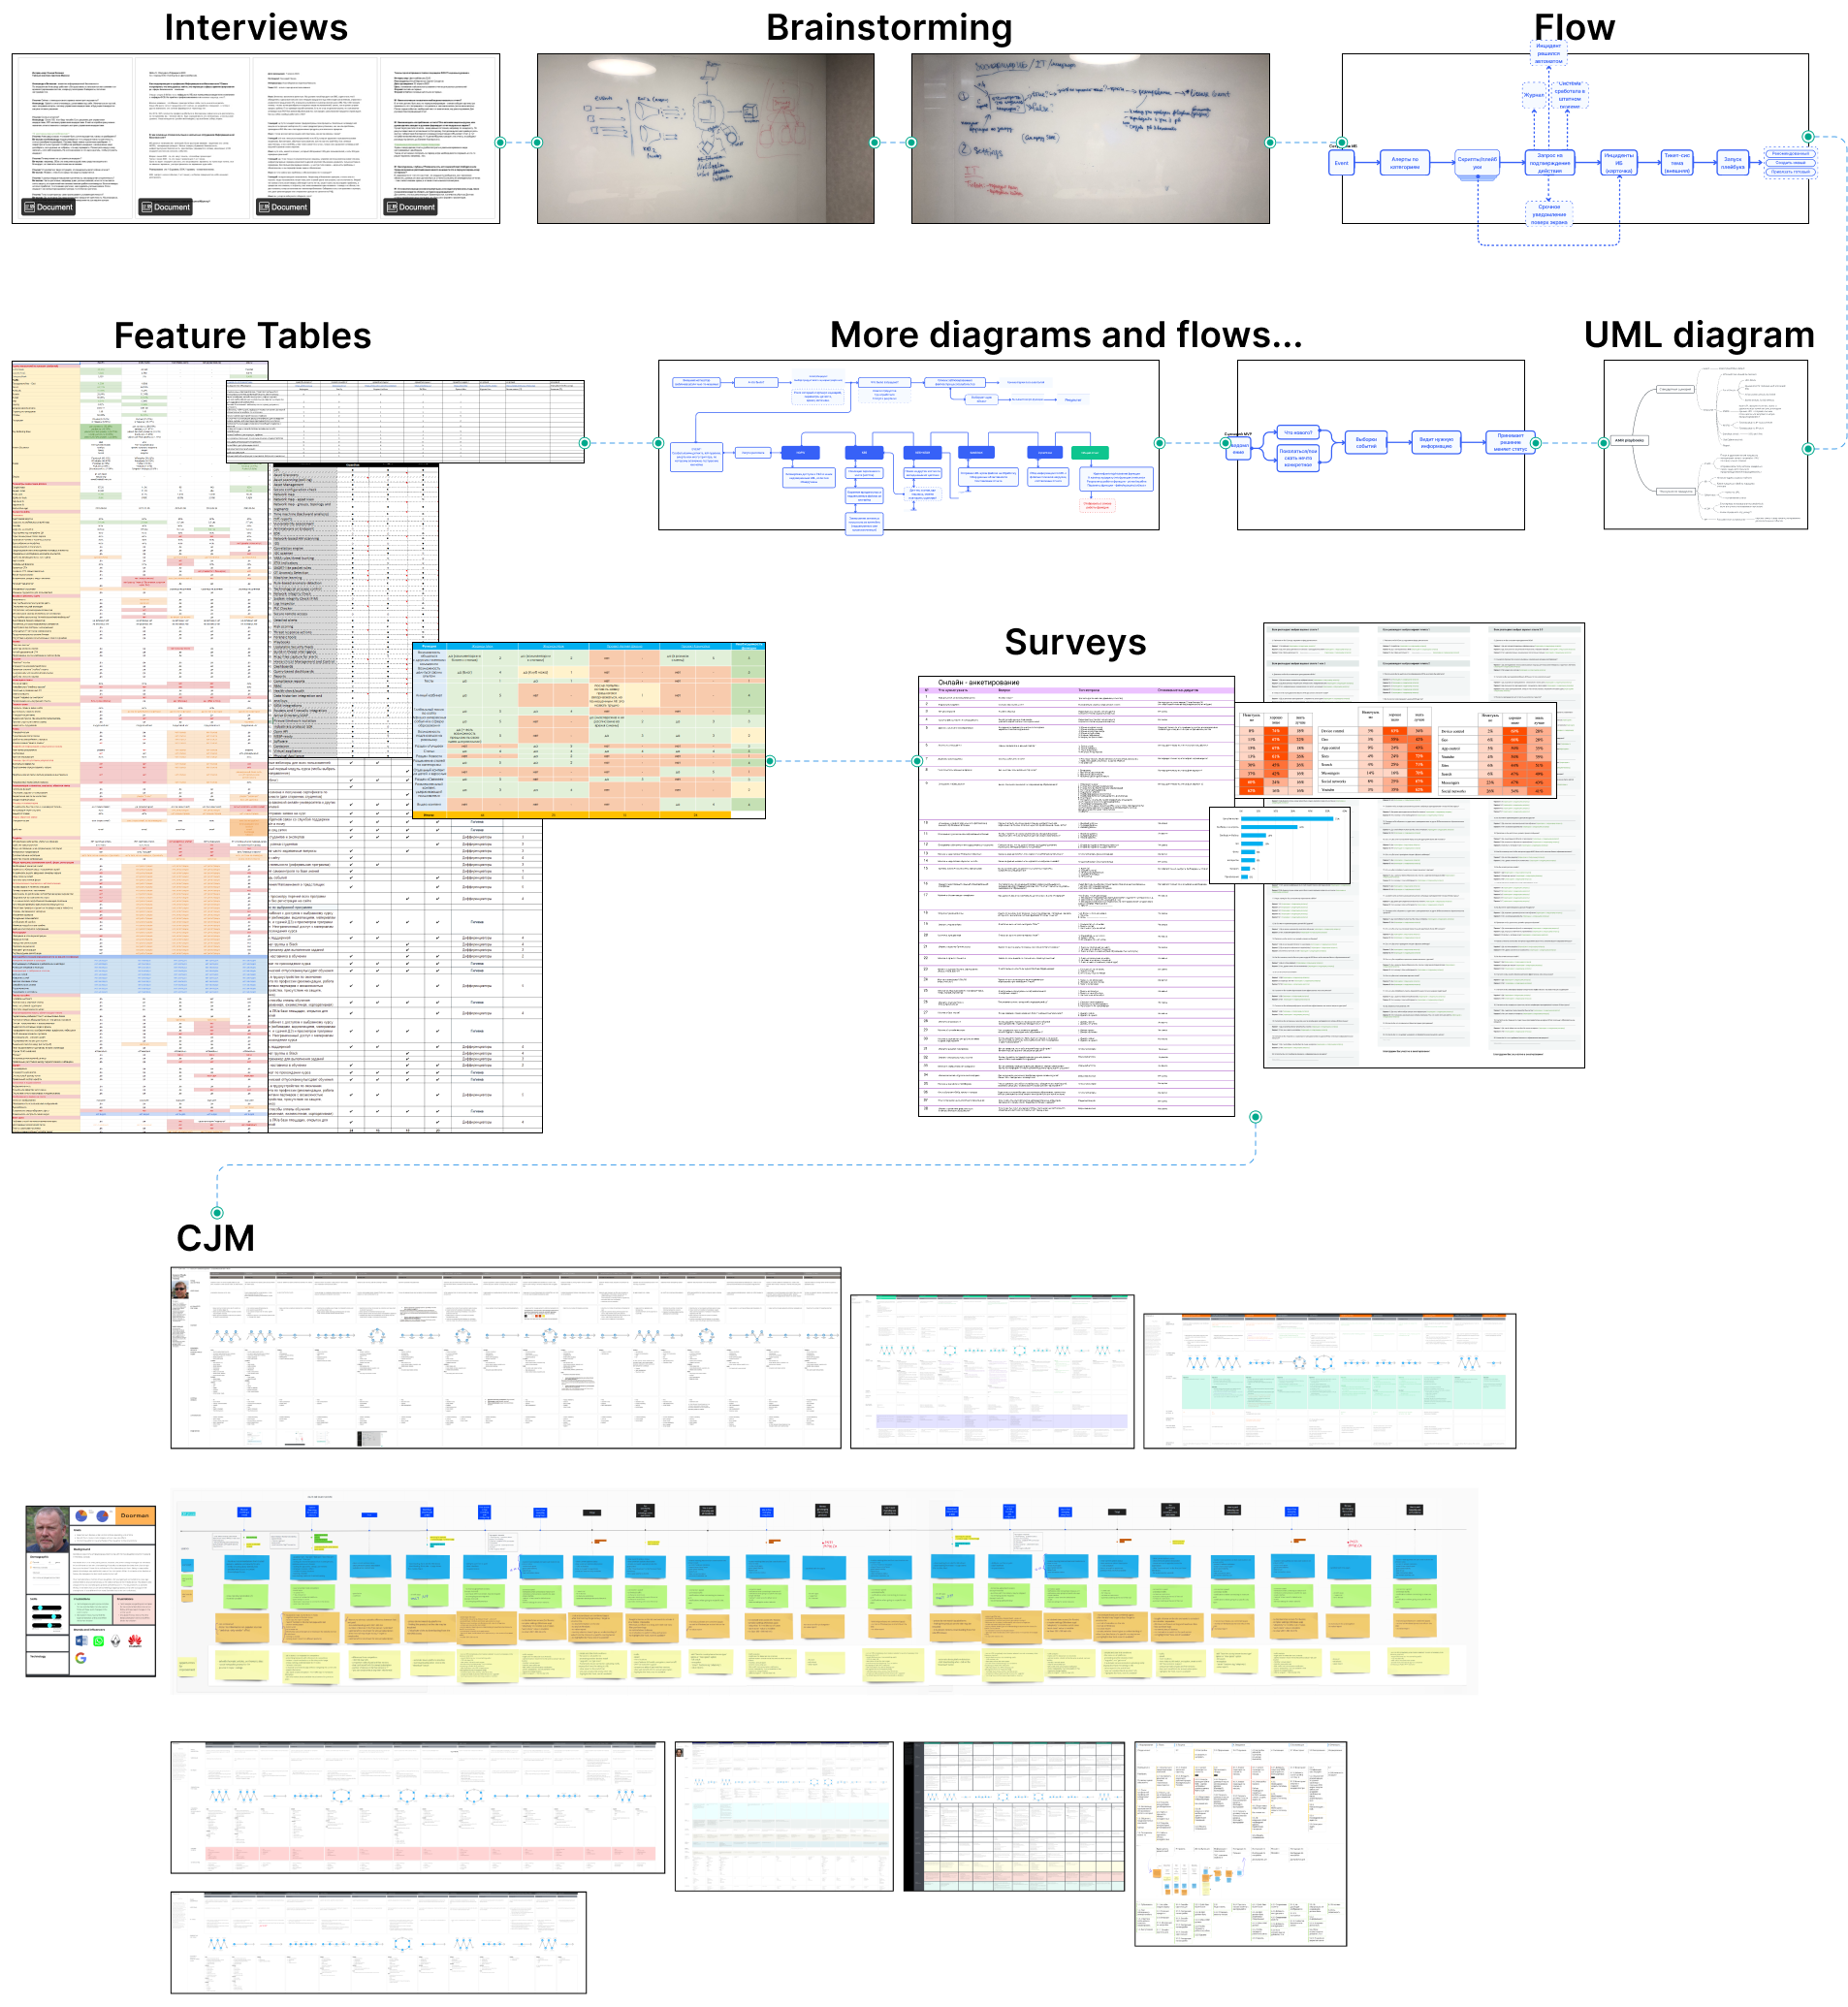
Data is collected, and what to do with it now? The numbers for the sake of numbers is not needed. First, you need to give the local expert the opportunity to familiarize all the data, and after give data to the server for analysis. The reasons for idle time are entered to the messenger-bot and special report, this is in addition to the automatic data collection system. Sometimes we met strange problem: if you free 4 machines from 8, then the question arises – where to put the remaining 4 free machines?
First of all, I researched all the equipment management system. And figured out, what actually on the market many manufacturers with absolutely same questions and demands. A lot of machines and equipment idle without work and main question: what is the cause of downtime? It’s not the only one question. A got the most popular questions: what equipment is loaded, why it fails, how investments in the purchase of new machines are justified. Another need that I identified while communicating with production is the precise control of old equipment. Many manufactories very old and it’s question of live for business and people to have a great control for old and unreliable equipments. And it was the milestone, where our customers move from classic table view to node tree page. UX and attention to detail makes a difference.
We helped not only “Blue Chips”, it’s all companies with energy, metallurgy, oil and gas extractive and refining industries, mechanical engineering. It’s also Critical Infrastructure sector, where we met NPPs, hydroelectric power plants, water treatment companies, military industry, chemical industry, smart cities, railway transport industries. It’s also small manufactures in Emerging Markets, like India, Turkey, Egypt, Indonesia, Thailand, Brazil, Argentina, Mexico and so on. And High-volume manufacturer for sure, you know, something like mass-produced enterprises, for which the most important criterion is the quality of goods, uninterrupted production lines and occupational safety. So we met all range of requirements, from integration with SIEM, Historian, Firewall and the product must detect all classes of threats: malware, misconfiguration, network attack, IT anomaly, OT anomaly, to the ease of deployment and settings up and detailed and clear alerts with reaction recommendations.
All this leads an ordinary designer to a simple idea: many industries, many different roles, let’s use tables! But not me. I talked to a lot of users, collected a lot of data, analyzed all the competitors, and each screen was made with deep elaboration depending on the tasks that are solved on each particular screen in each particular flow. Well, tables where they’re needed too.
In parallel, we have developed courses for staff training (≈ 2 700 people per year).
Main component: Tree Nodes
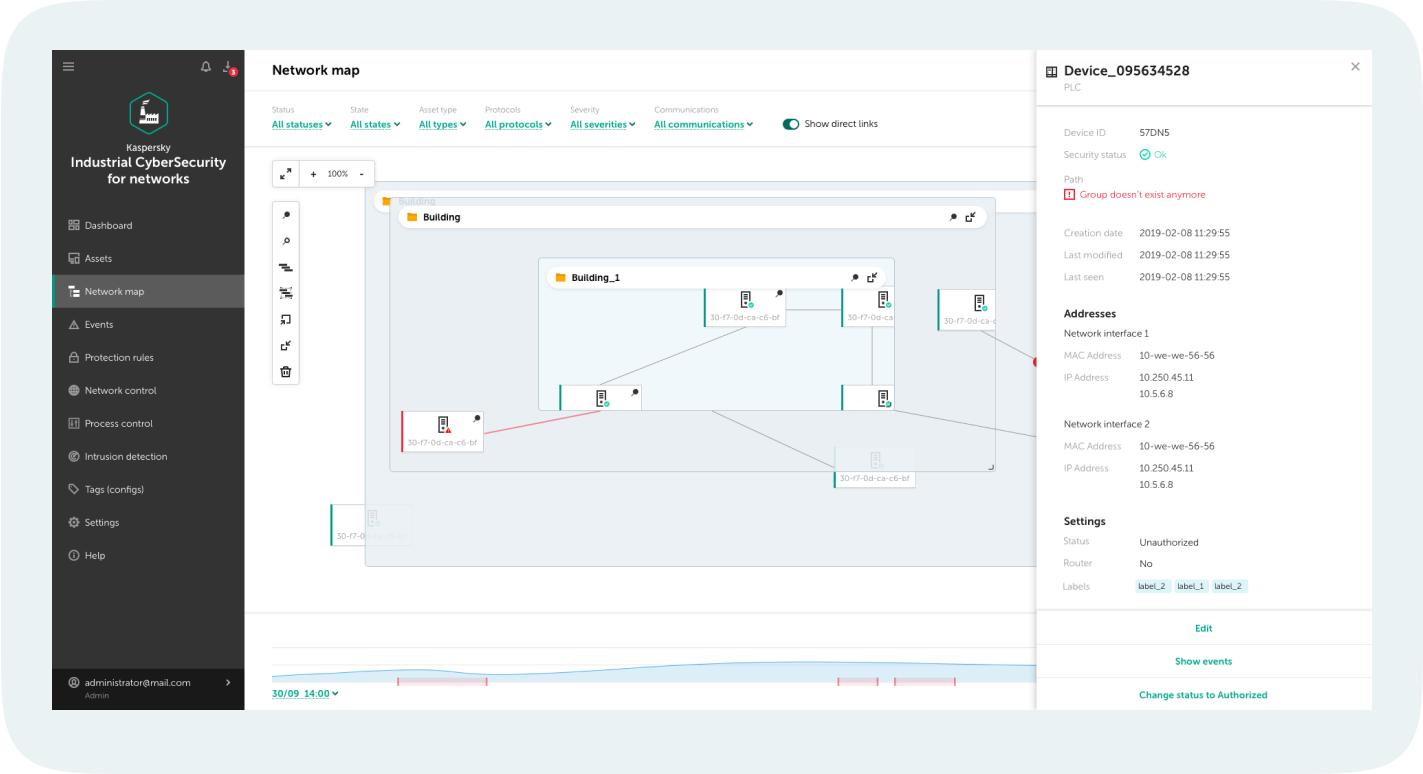
Pictures and animations starts here 🏞️! To be honest, I am convinced what basically Node Tree is the most convenient way to work with networks. Not large tables with a complex filtering system, not a command line, not even a dashboard. Only Node Tree, which is actually must be considered just a very complex and interactive infographics.
Our Node Tree has many micro-interactions. Thousands of them. Thus, we had completed many challenging tasks to make the Node Tree in our product one of the best on the market. I’m thankful teams of adobe XD and After Effects, them were very useful tools to prototype it. So, for example, if a single node has a position above the line between two other nodes, this can be perceived as this one node has a link between another two nodes. I offered and we invented a special algorithm to move away nodes from lines. Easy and helpful! And math, of course.
Additionally, I decided to add special anchors to the nodes, this can help to understand where the links come from and where. Below you can see how great we are, flexible and nice interface in real time. After few UX-testings I got, that was wrong idea. But I still love it.
In large-scale production, the system may have about 10 000 nodes, enormous number. And it is difficult to navigate and find the exact right group or node, what the person wants. Therefore, we have added some additional logic: when you click on one node, you will see only all connected nodes, all the rest will be disabled. You also able to click on lines, groups and everything else.
Finally, interim profit: output growth on existing equipment. It is more comfortable to work with a nodes map than with a classic table. Okay, I’m lying. It’s not just comfortable, it’s inexpressibly better. It’s gamification. And it was the milestone for the product, where our customers move from classic table view to node tree page. UX and attention to detail makes a difference.
And so on, we can group our nodes, like one group for press-forging works, and inside it many machineries. And another group it’s smartphones of workers. So, groups have to inherit all logic, which I showed to you before.
But how much more problems we would meet? Oh my friends, you can’t even imagine real amount of senior-level tasks I came through. For example:
- How to group-up nodes?
- How to group-up group of nodes?
- How to pin a group of nodes inside a group of nodes?
- How to resize group with nodes with a group of nodes inside another group of nodes, and some of them pinned. But not all.
- In a group, we have 2 nodes and boom! we add 2 000 nodes into this group. How to show it? In dynamic, of course.
- Of course, we must be able to expand/collapse groups of nodes;
- And also, if one node without a group will appear under a group in a group in a group and so on deeper, how to show it;
and the endless amount of other specific questions. It’s impossible to find an answer on Google. It’s also impossible just copy UI of competitor’s services, all of them were not enough well-made (according to my professional opinion, of course). So, it was an endless opportunity to perform a UX job and technical researches. We have a lot of big clients. I said about 10,000 nodes, and big companies meet something like this. And it’s not alright.
But I can handle it – Grouping:
Whole product
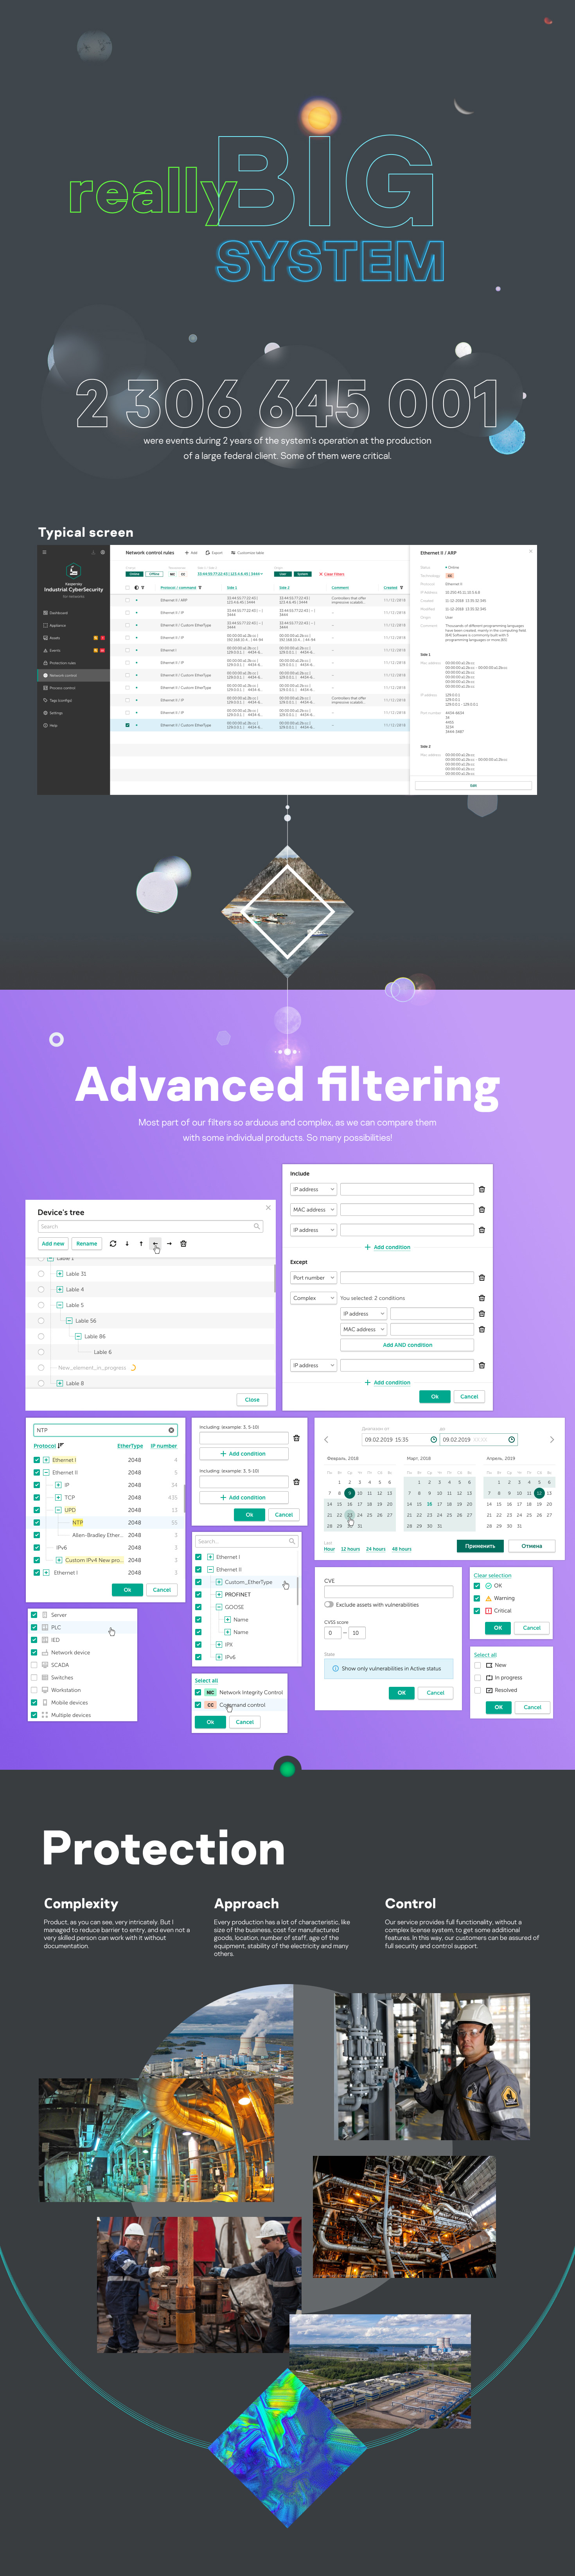
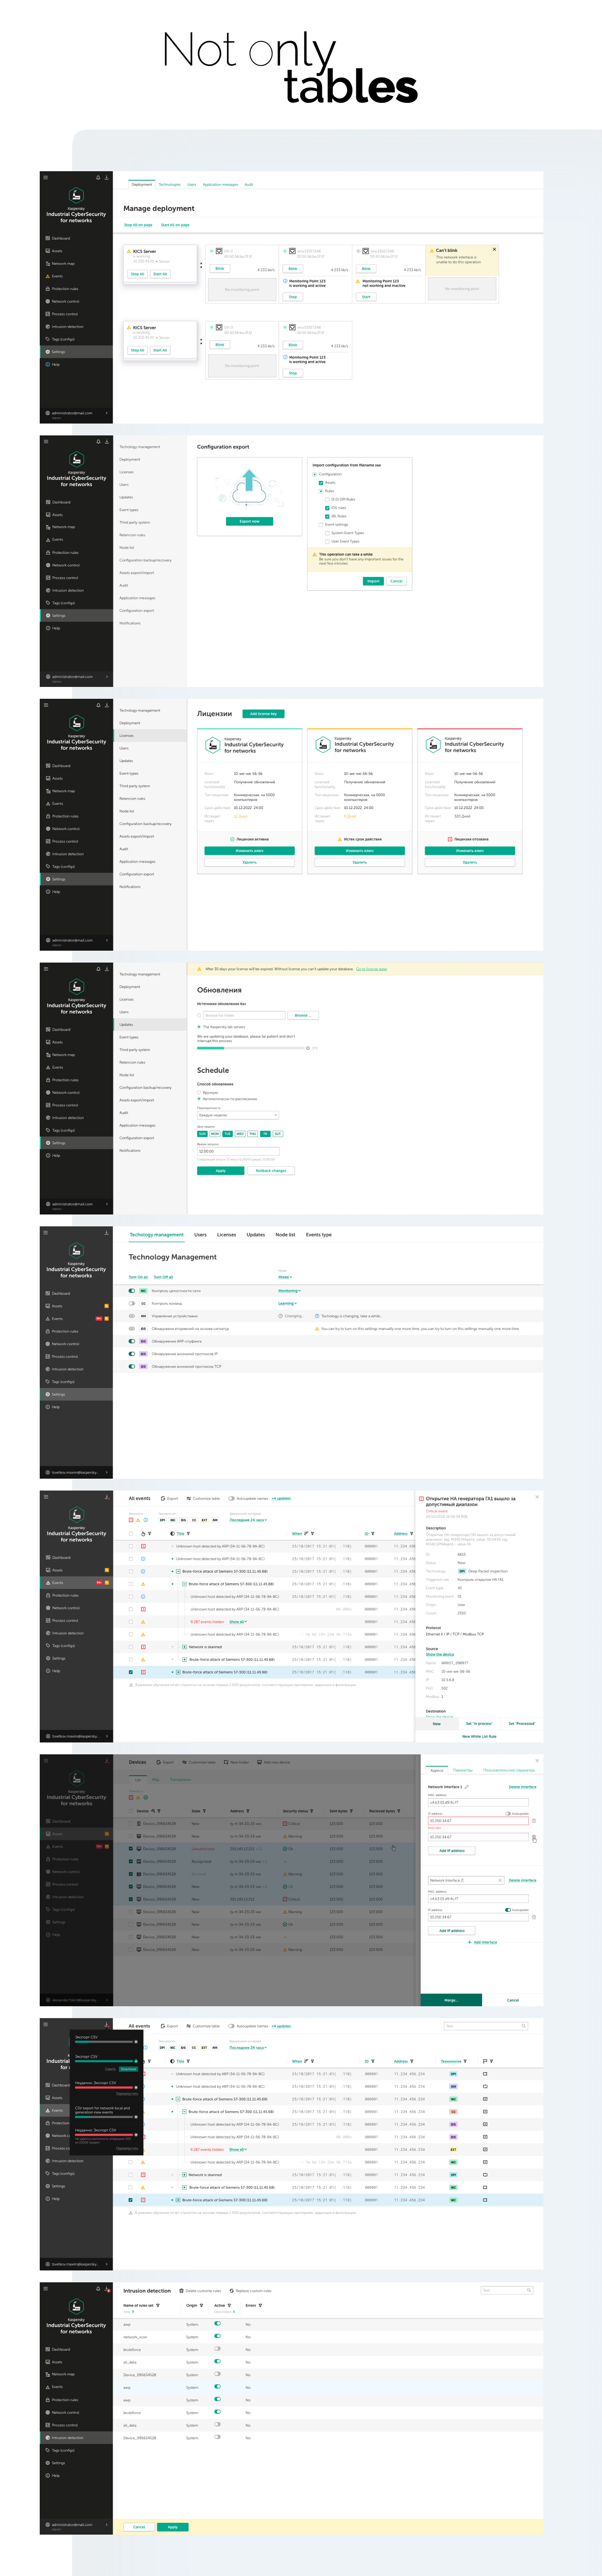
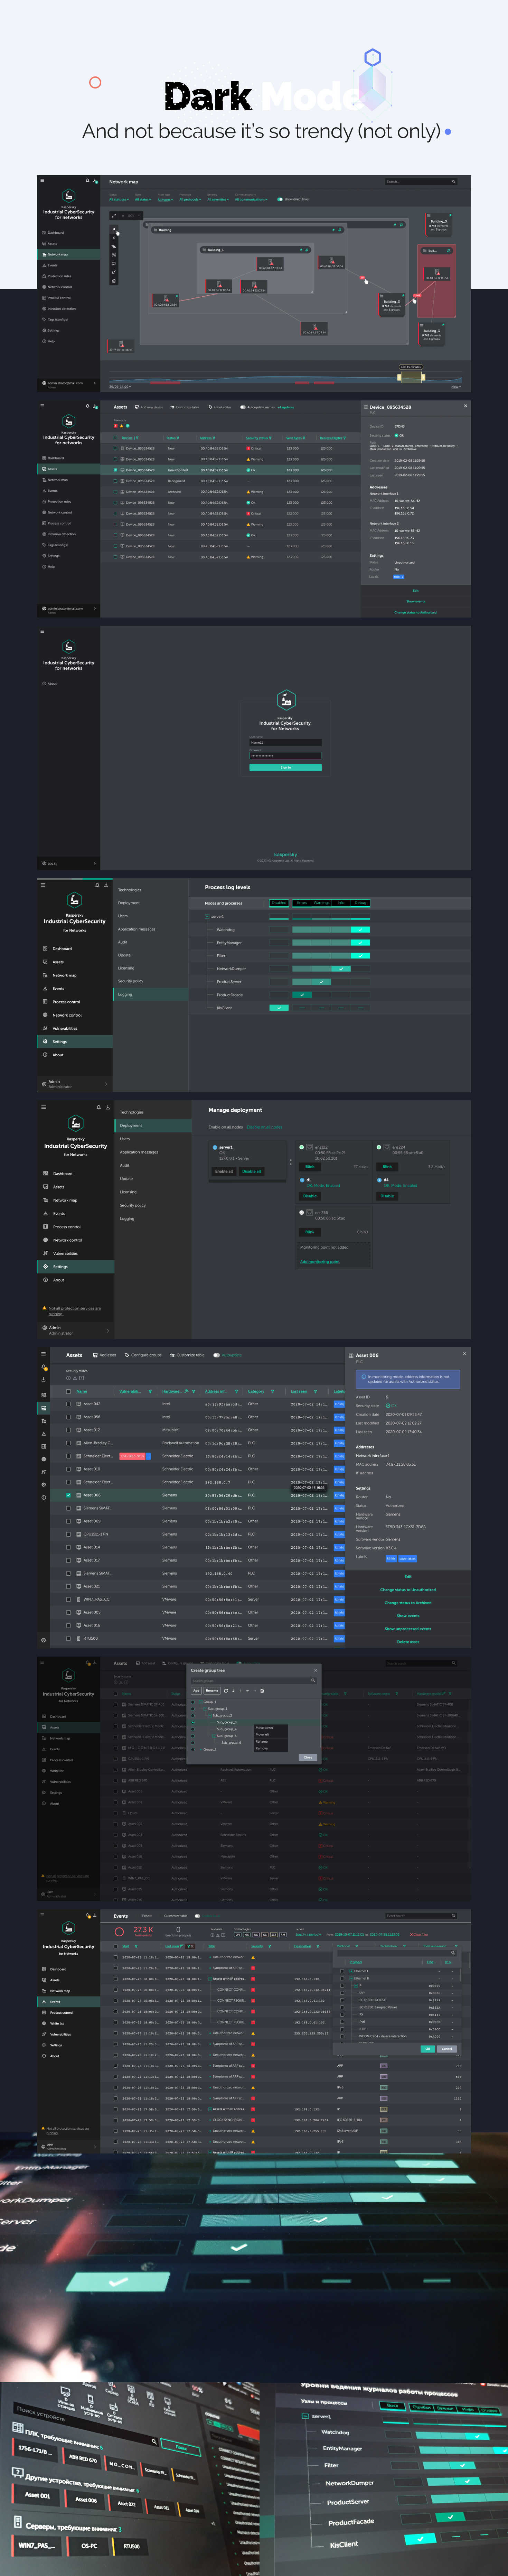
This product is not about beautiful pictures. Of course, it has to have a fine and modern visual design, but main problems were like: what to do with table on 1 000 000 rows, when it’s real-time updates? or how to upgrade the system, if we don’t have an internet at all?
Tables one of the most used part of interfaces ever. So we paid a lot of our attention to our tables, we want our users to control everything. Of course, it’s must be absolutely resizable table columns, it must be a really responsive table for our customers. You know, I saw a lot of software products with a terrible level of flexible. Everything was fixed in absolute values, and it was very inconvenient for users. Even Google tables don’t provide enough level of flexibility and responsiveness. So, we created it in a very customizable way, so every user can adapt it for every screen size, from 1024 till 4k.
Our tables have many hotkeys and flexible ways to use. We may have and must to provide millions of rows in a table and we need to manage it. So, I would share some of my approaches for it. Our user can press ctrl+A and select ALL millions of rows. Because the amount of rows is changing every second, we decided don’t show the exact number, but just show the text “selected all”. We tested it and there is no misunderstanding. Also, much as every complex tool, we supported the right mouse click for menu.
This system also can be used as a smart city, providing cities and automotive safety and stability in U.S. China, Franc, Japan, India, Italy, Great Britain, Canada, Spain, Germany, Russia, Switzerland, and others.


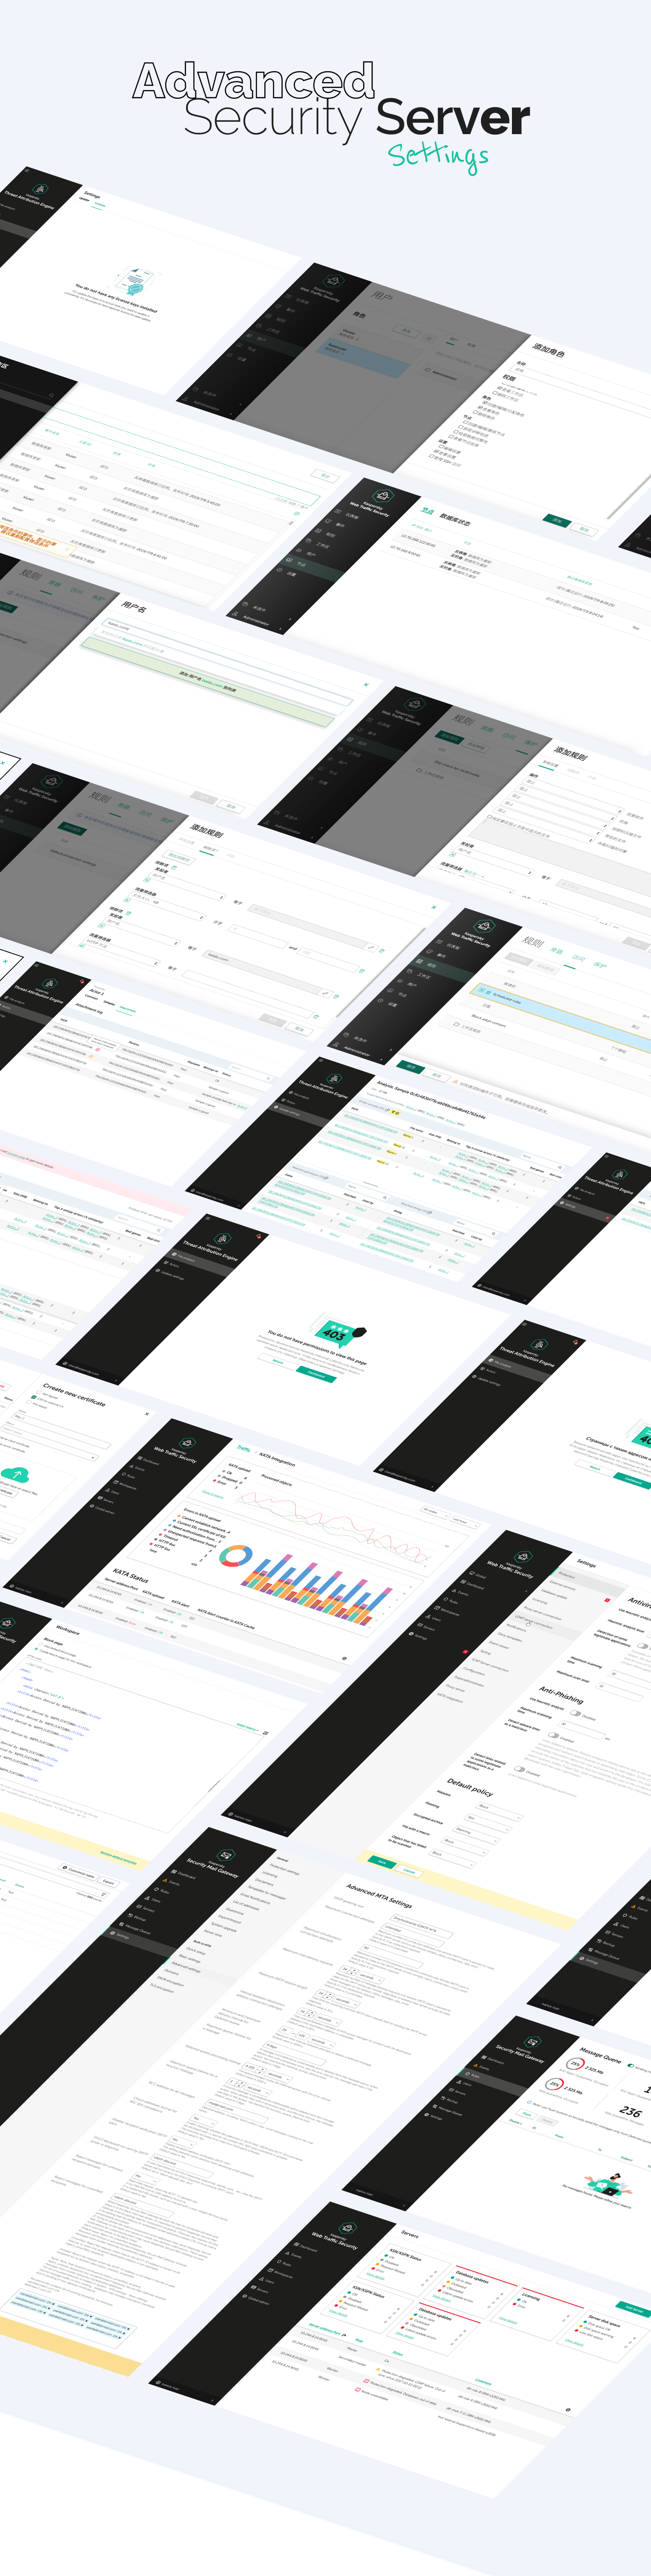
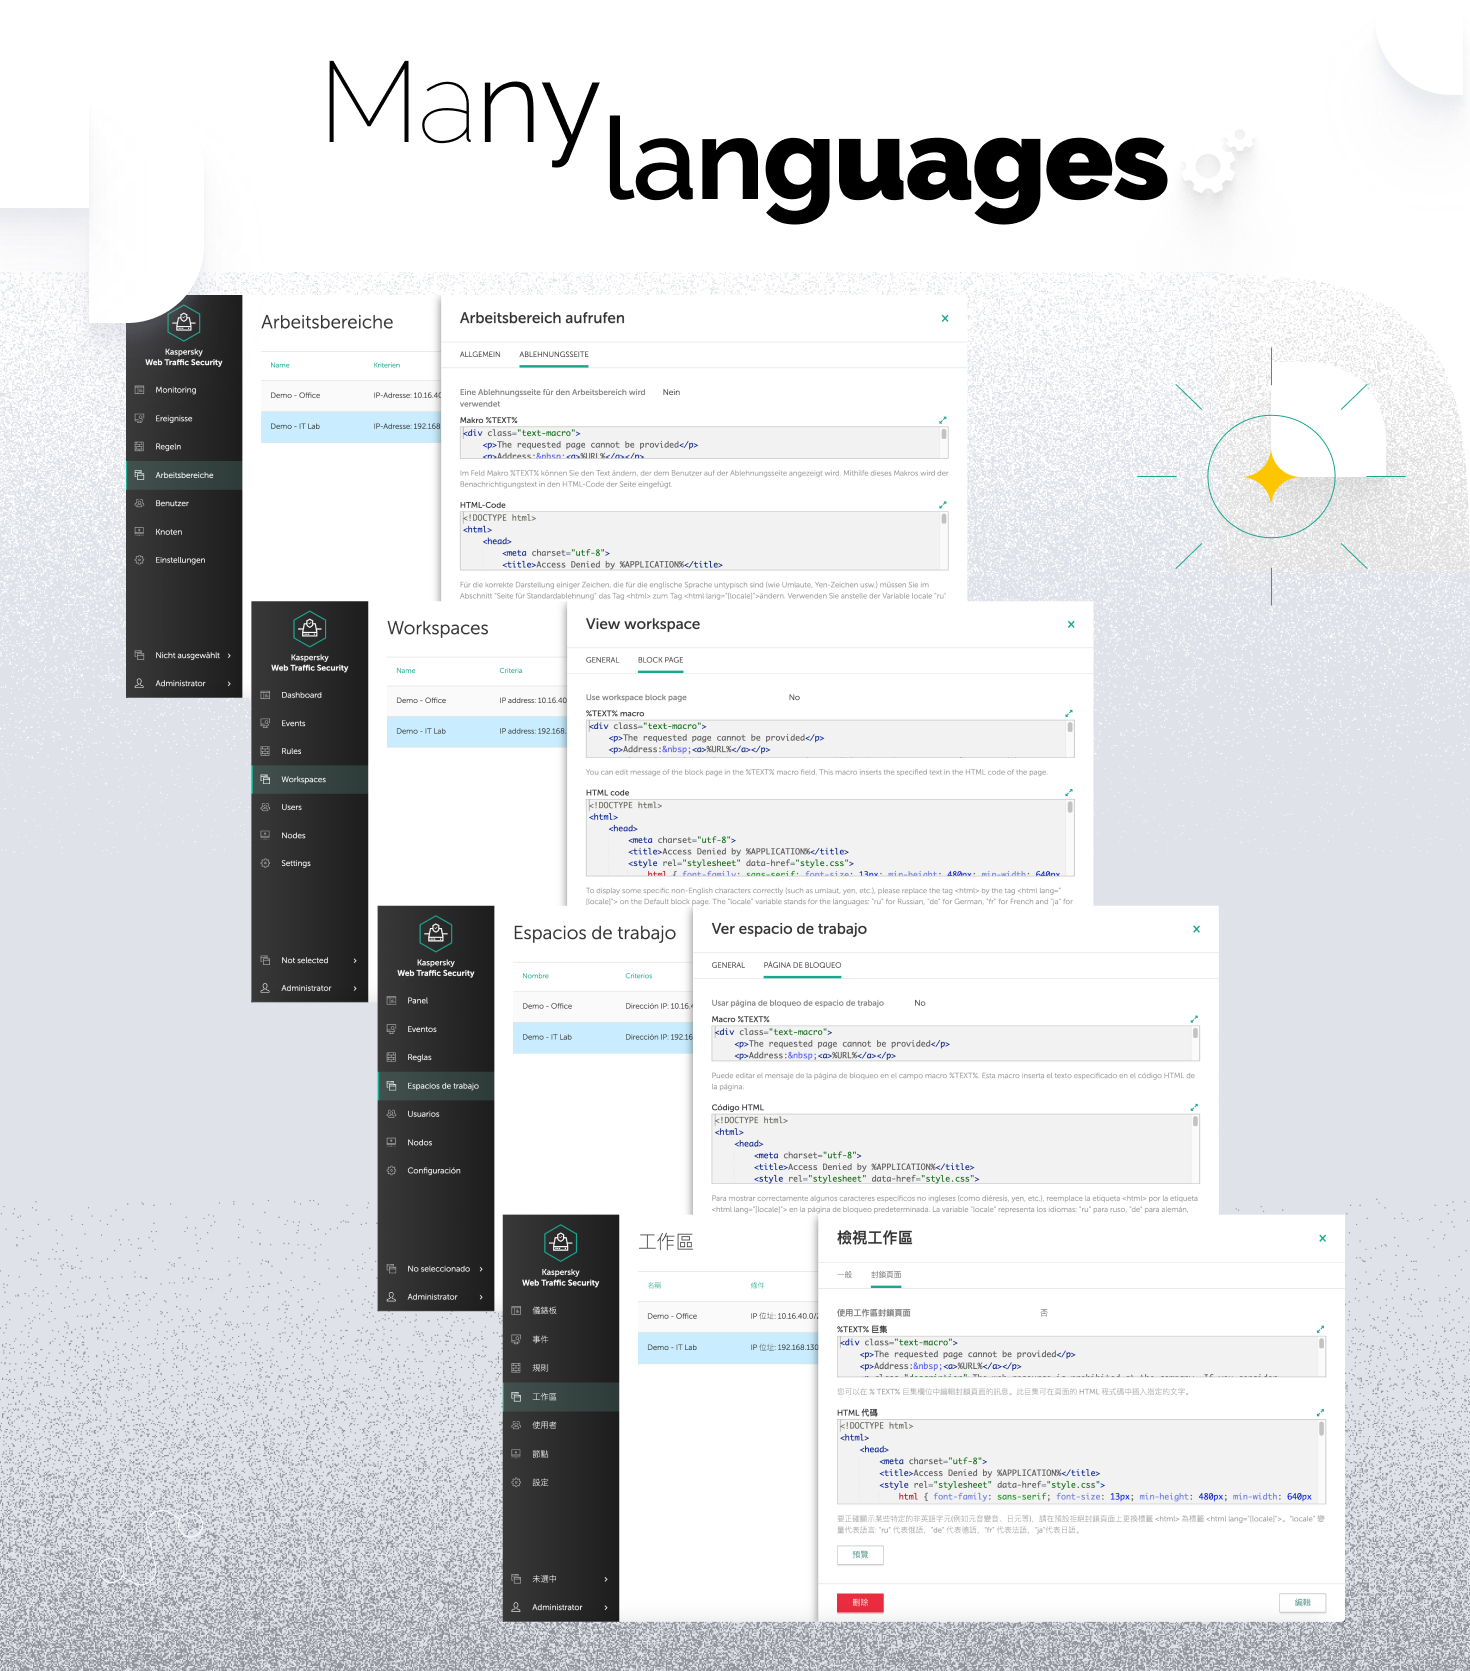
By the way, it’s not only one system. For example, we also created special Proxy Service for manufactures with Internet (remind: many manufacturers don’t have an Internet at all). It’s not so complex and big product, but very minimalistic and convenient. We are fully support 15 languages for all our systems, including two version on Chinese (simplified and traditional) and English (British and American). Mostly, the product is in demand in Arab and Asian countries. And Europe, of course. So I planned the layout based on the most complex and entangled languages. This imposed a lot of design restrictions, but made development life much easier. Many other services for our eco-system was also made by me. It’s Kaspersky Web Traffic Security, Kaspersky Secure Mail Gateway, Kaspersky Threat Attribution Engine, Kaspersky Next Generation Firewall.
Between April 2018 and May 2020, various types of anomalies were detected: – process deviations due to periods of change of modes; – manual switching of control circuits to the manual mode; – situations related to incorrect sensor readings. Information security specialists received a tool for automatic early warning of dangerous situations.
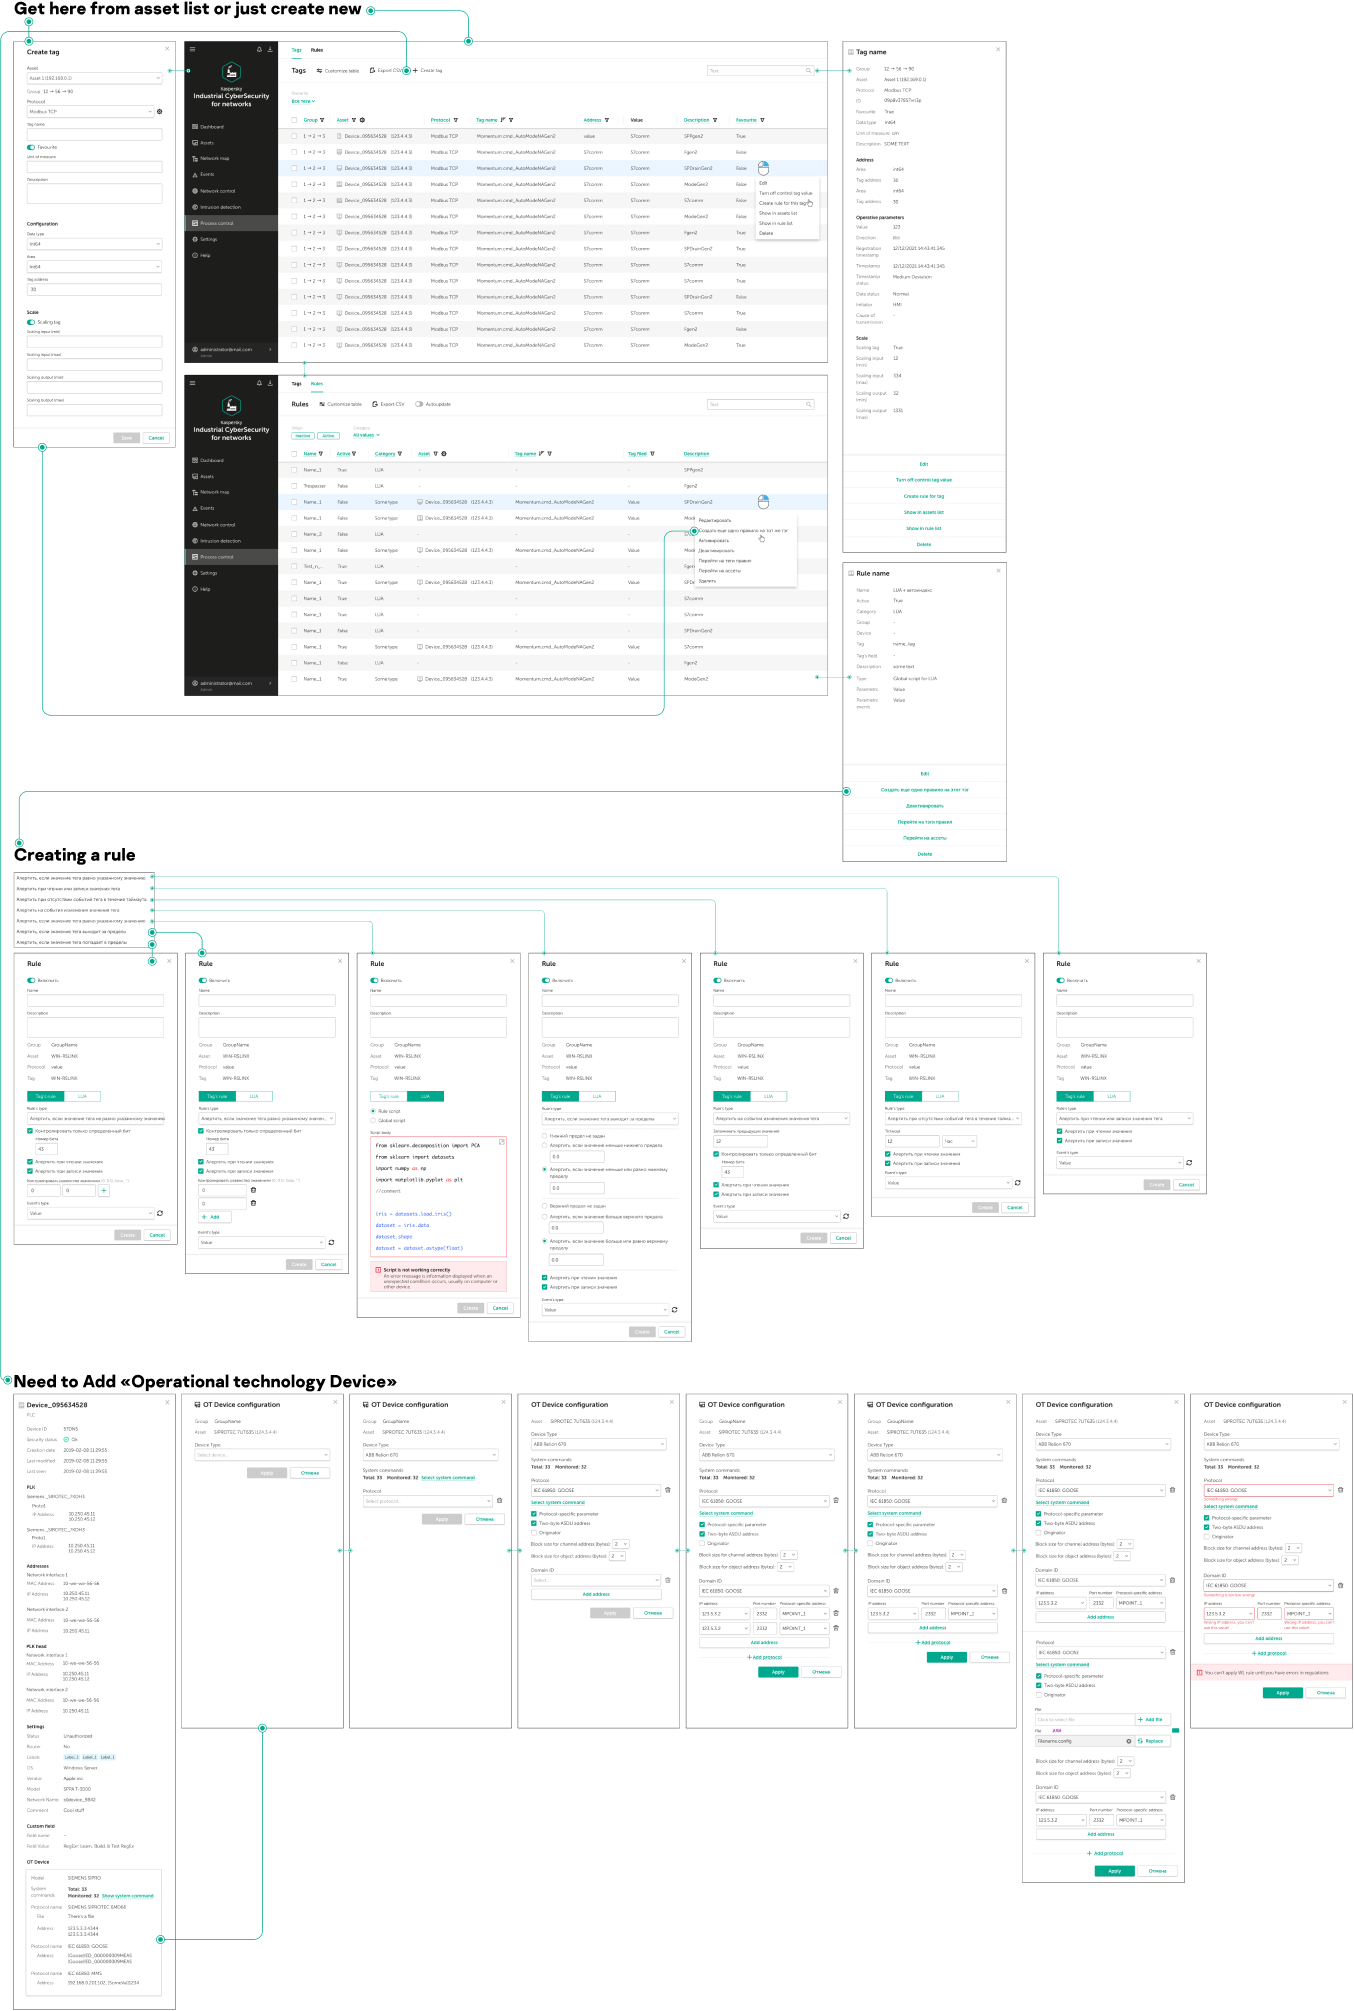
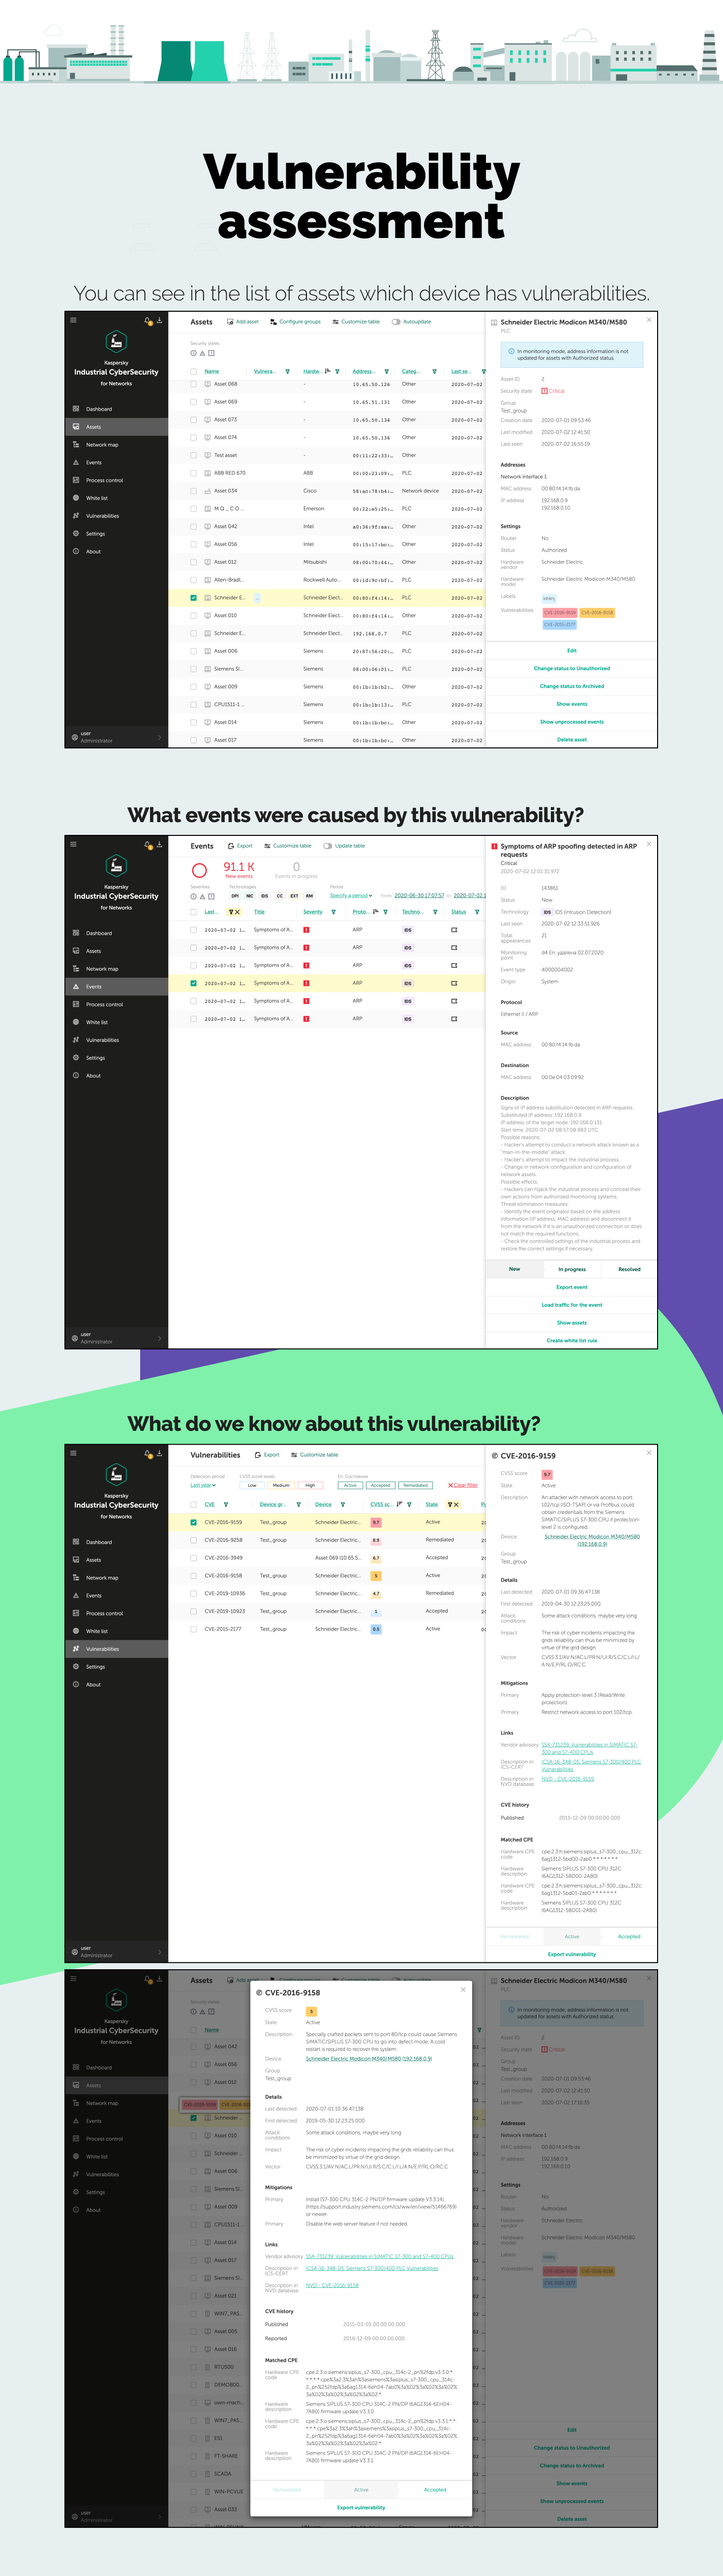
Case! on information security market we have Common Vulnerabilities and Exposures (CVE). This is public base of common Vulnerabilities, and every company has their own base of them. So, we decided to support this in our product. And I started to research this, how our competitors do it, what is user needs and so on. And… I got many small, but painful problems. For example, important part of the information is CVSS Score (0-10 importance level), and in every system they interpret it differently. For some companyes critical level is 8-10, another can start even from 6. But I managed it after 20 interviews.

In the course of my work, I identified many business problems. And they kept the business from growing. During our constant communication, we came to the following theses:
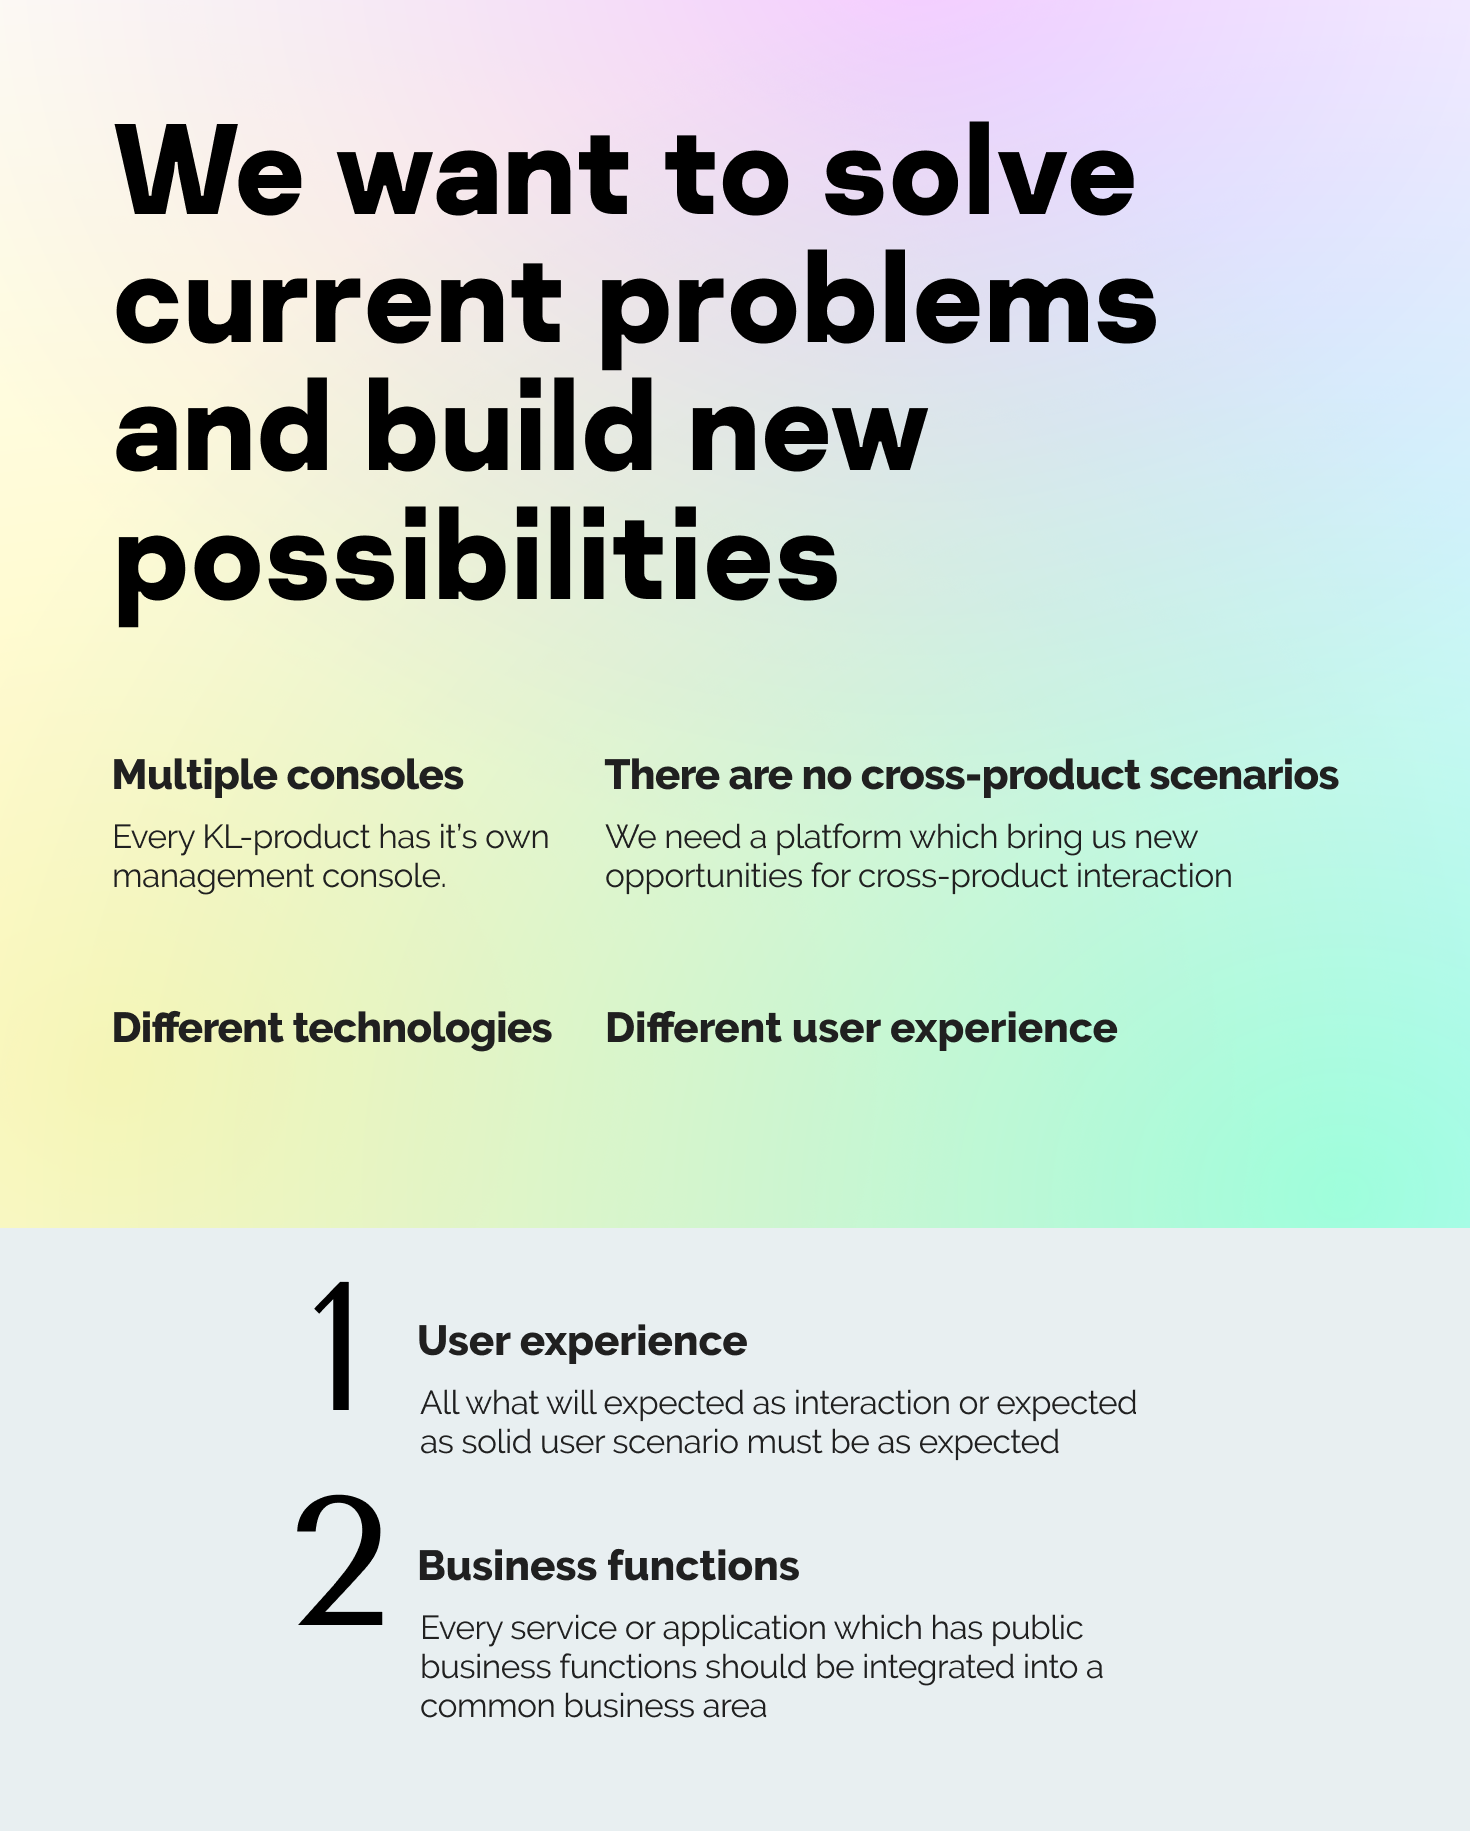
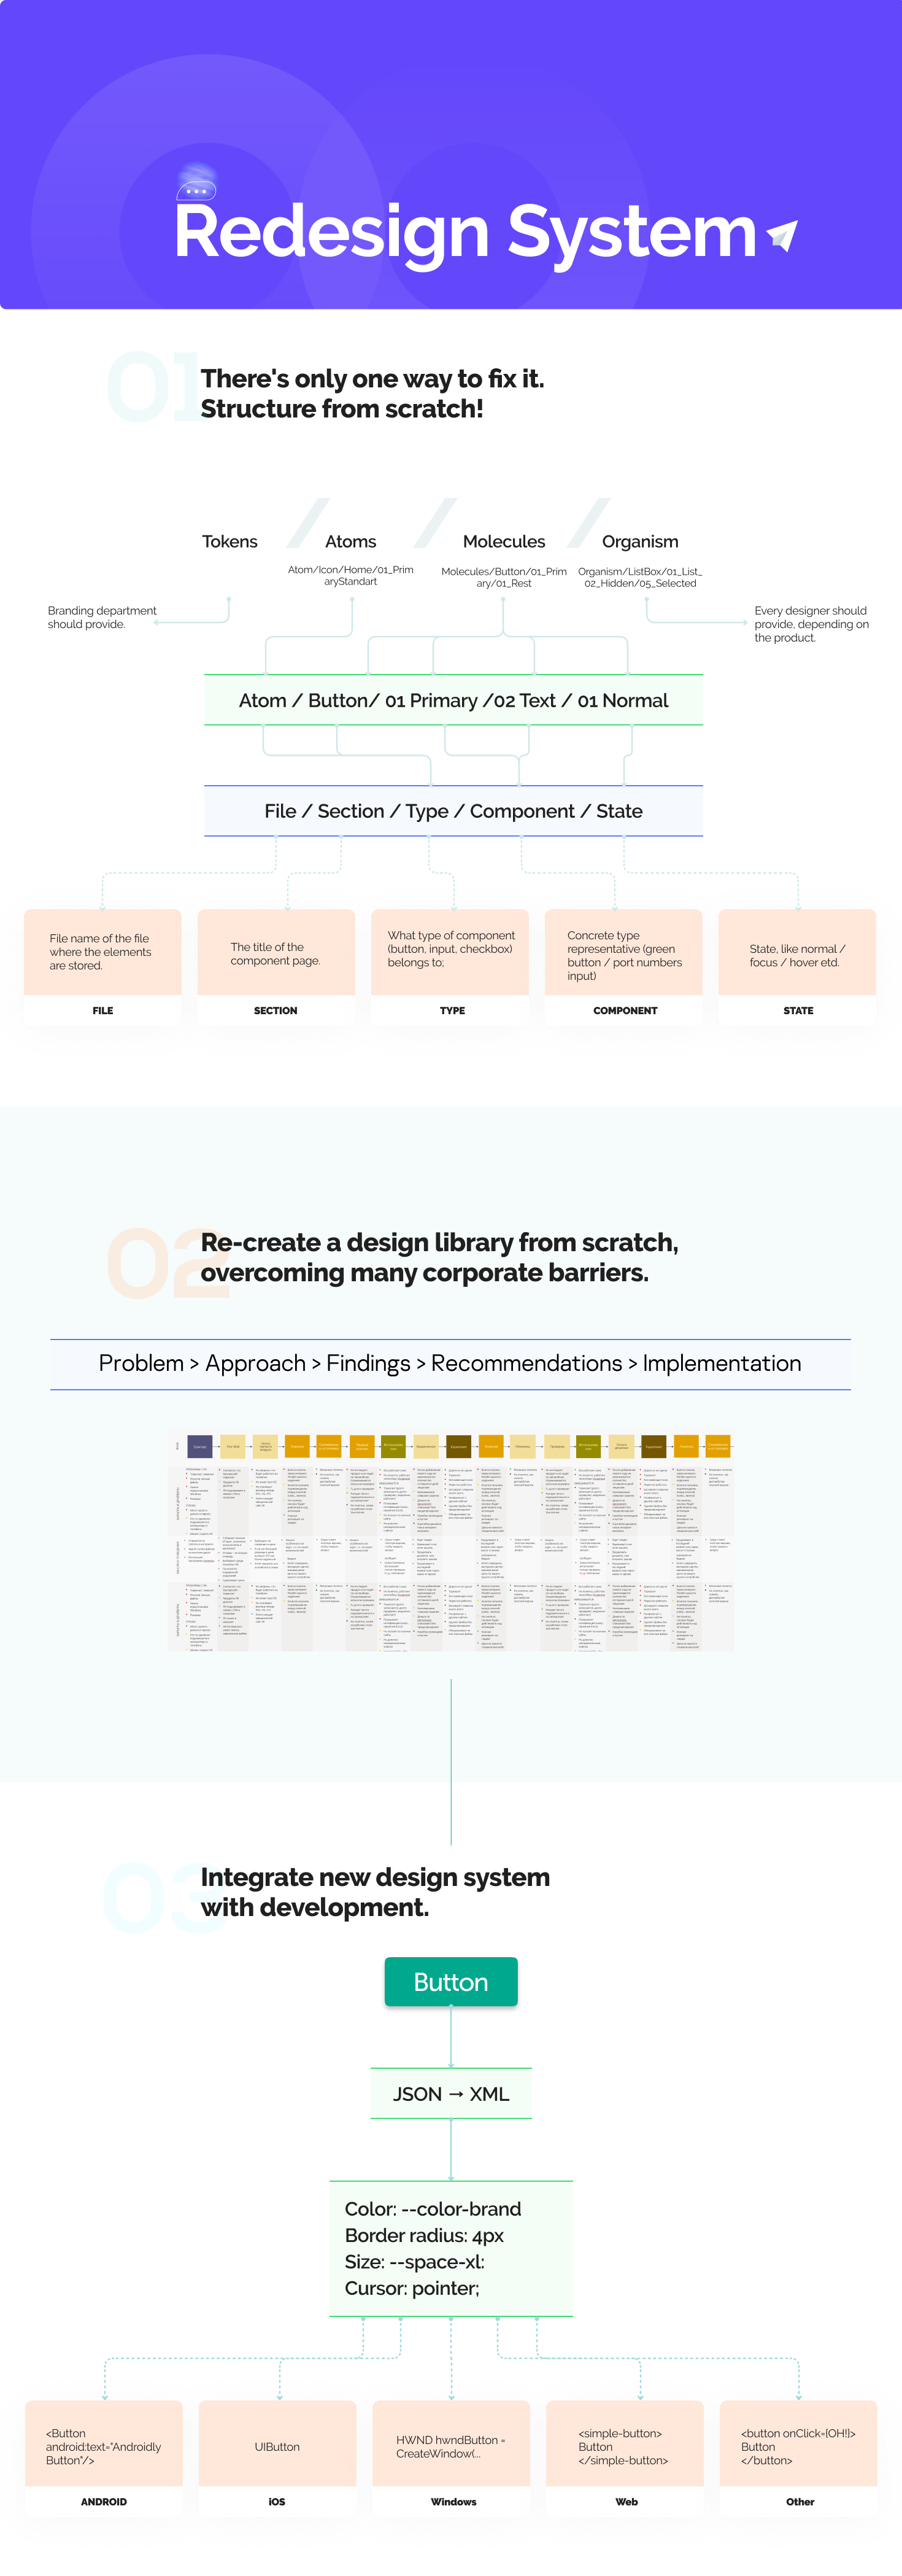
It is a huge task, to change almost the entire product line of the company in accordance with market requirements. In the course of many approaches to this task, that’s what I realized:

We, the whole team, have come to unique complex system of creating layouts and transferring them into development. It is not a simple question of classical rules for all designers, but of a full-fledged conveyor to transform the long-term clumsy legacy into a modern and flexible system. And basis for this were my product.
Some presentations: